Why Household Size Changes Your Subsidy Even If Income Doesn’t
Adding or losing a household member shifts the poverty-line comparison that drives the subsidy formula.
In one line
This explainer covers: How household size enters the subsidy formula
On this page
How household size enters the subsidy formula
Most people assume subsidy eligibility is mainly about income: earn less, get more help; earn more, get less. That’s true as far as it goes, but it skips a step that does most of the actual work in the formula. Before your income is ever compared to a threshold, it’s converted into a percentage of the federal poverty line for your household size. That conversion is where household size quietly changes the outcome.
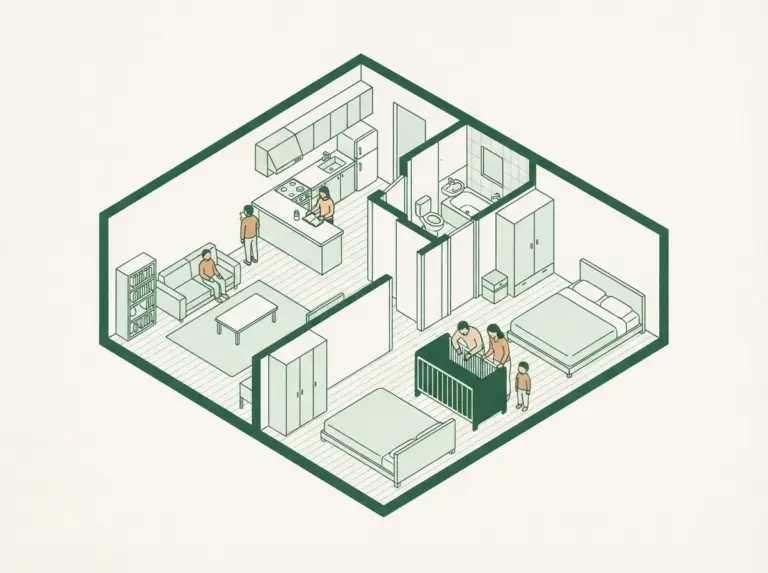
The poverty line isn’t a single number. It’s a schedule that rises with each additional person counted in the household. A household of one has a lower poverty line than a household of three, which has a lower line than a household of five, and so on. The exact dollar figures are published annually and updated periodically during the year for program purposes, so this article won’t cite specific numbers — check the current federal poverty guidelines or your program’s documentation for the figure that applies right now.
Once you know your household size, your income is measured as a percentage of the poverty line for that size. That percentage — not your raw income — is usually what gets plugged into the subsidy calculation, whether that’s a health insurance premium tax credit, a cost-sharing reduction, or a discount program tied to income eligibility. Two households with identical incomes but different household sizes will land at different percentages of the poverty line, and therefore different subsidy amounts.
Why the same income can produce a different subsidy
This is the part that surprises people, because it seems counterintuitive at first: nothing about your paycheck changed, but your subsidy did. The mechanism is straightforward once you see it laid out.
Suppose a household earns a fixed income. If that household has two people, the income might represent, say, 180% of the poverty line for a two-person household. If a third person joins the household — a returning adult child, a new dependent, an aging parent who moves in — the same income is now measured against the higher poverty line for a three-person household. The percentage drops, because the same dollar amount is being divided by a larger threshold. A lower percentage of the poverty line generally means more subsidy eligibility, not less, in most sliding-scale programs.
The reverse happens when someone leaves the household. If a household member moves out, dies, or is no longer counted as a dependent, the same income is now measured against a smaller household’s lower poverty line. The percentage rises, and the subsidy shrinks or disappears — even though the household’s income, in absolute terms, hasn’t budged.
This is why two neighbors with the same job, the same salary, and the same tax bracket can receive noticeably different subsidy amounts. The formula was never comparing their incomes directly. It was comparing each of their incomes to a household-size-specific threshold, and household size is doing as much work as income in determining where each person lands.
Common household-size changes that trigger this
Household size isn’t just about who lives under the same roof. Most programs define “household” using tax-based rules — who is claimed as a dependent, who files jointly, whose income counts toward the household total — rather than a simple headcount of residents. That distinction matters, because it means household size can change even when nobody physically moves.
Some of the more common triggers include:
- A child is born or adopted. A new dependent increases household size and typically increases the applicable poverty threshold, which can improve subsidy eligibility even if income rises slightly at the same time (for instance, from a return to work after leave).
- A young adult ages out of dependent status. If a child stops being claimed as a tax dependent — often around the point they file their own return or age past the program’s dependent-age rule — the household shrinks for eligibility purposes, even if they still live at home.
- Marriage or divorce. These changes can merge or split household income and household size simultaneously, which is why remarriage or separation often triggers a full recalculation rather than a small adjustment.
- An elderly parent or adult relative moves in. If that person is claimed as a dependent, household size increases. If they’re not claimed as a dependent, they may not count toward household size for the program’s purposes at all, even though they’re physically present — this is a frequent point of confusion.
- A death in the household. Losing a household member reduces household size and can push the remaining members’ income to a higher percentage of the poverty line, reducing subsidy eligibility during an already difficult time.
- A dependent’s income changes. Some programs count a dependent’s income toward household income even though the dependent doesn’t change the headcount — meaning household size and household income can shift independently of each other, sometimes in offsetting directions.
The common thread is that these changes often happen for reasons that have nothing to do with subsidy planning — a child grows up, a relationship ends, a parent needs care — but they ripple into the eligibility formula regardless of intent. This is why most programs require reporting a household size change within a set window, rather than waiting for the next annual review.
How this interacts with the subsidy cliff
Subsidy programs that scale with income as a percentage of the poverty line often have a point where eligibility ends abruptly rather than tapering off gradually — sometimes called a subsidy cliff. Household size changes can push a household toward or away from that cliff independently of any change in income.
Consider a household sitting just under the cutoff percentage of the poverty line. If a dependent ages out and the household shrinks by one person, the same income now represents a higher percentage of the new, lower poverty line for that smaller household. If that percentage crosses the cutoff, the subsidy doesn’t shrink gradually — it can stop, or drop to a markedly lower tier, depending on how the specific program structures its cliff or phase-out.
The inverse also holds: a household approaching the cliff from below can gain breathing room by adding a member, because the poverty line threshold rises and the same income now represents a lower percentage of that threshold. This is part of why financial guidance around subsidy cliffs often mentions household composition in the same breath as income — both variables move the same ratio, just from different directions.
It’s worth being precise about what this does and doesn’t mean. It doesn’t mean you should add or remove a household member for subsidy purposes — most programs define household membership by actual living and tax-filing arrangements, not by choice, and misrepresenting household composition to affect a subsidy determination can create real problems down the line. What it does mean is that if your household composition is genuinely changing — a child is about to age out, a parent is about to move in, a marriage is pending — that change is worth accounting for before you assume your current subsidy estimate will hold. The income side of the equation might look identical on paper next year. The household-size side often won’t.
If you’re trying to estimate where you’ll land, the practical takeaway is to treat household size as its own variable, checked against the current poverty guidelines for your expected household size, rather than folding it silently into an income estimate. The two numbers — income and household size — only tell you anything useful about subsidy eligibility when they’re compared together, at the percentage they produce, against the specific thresholds your program uses this year.